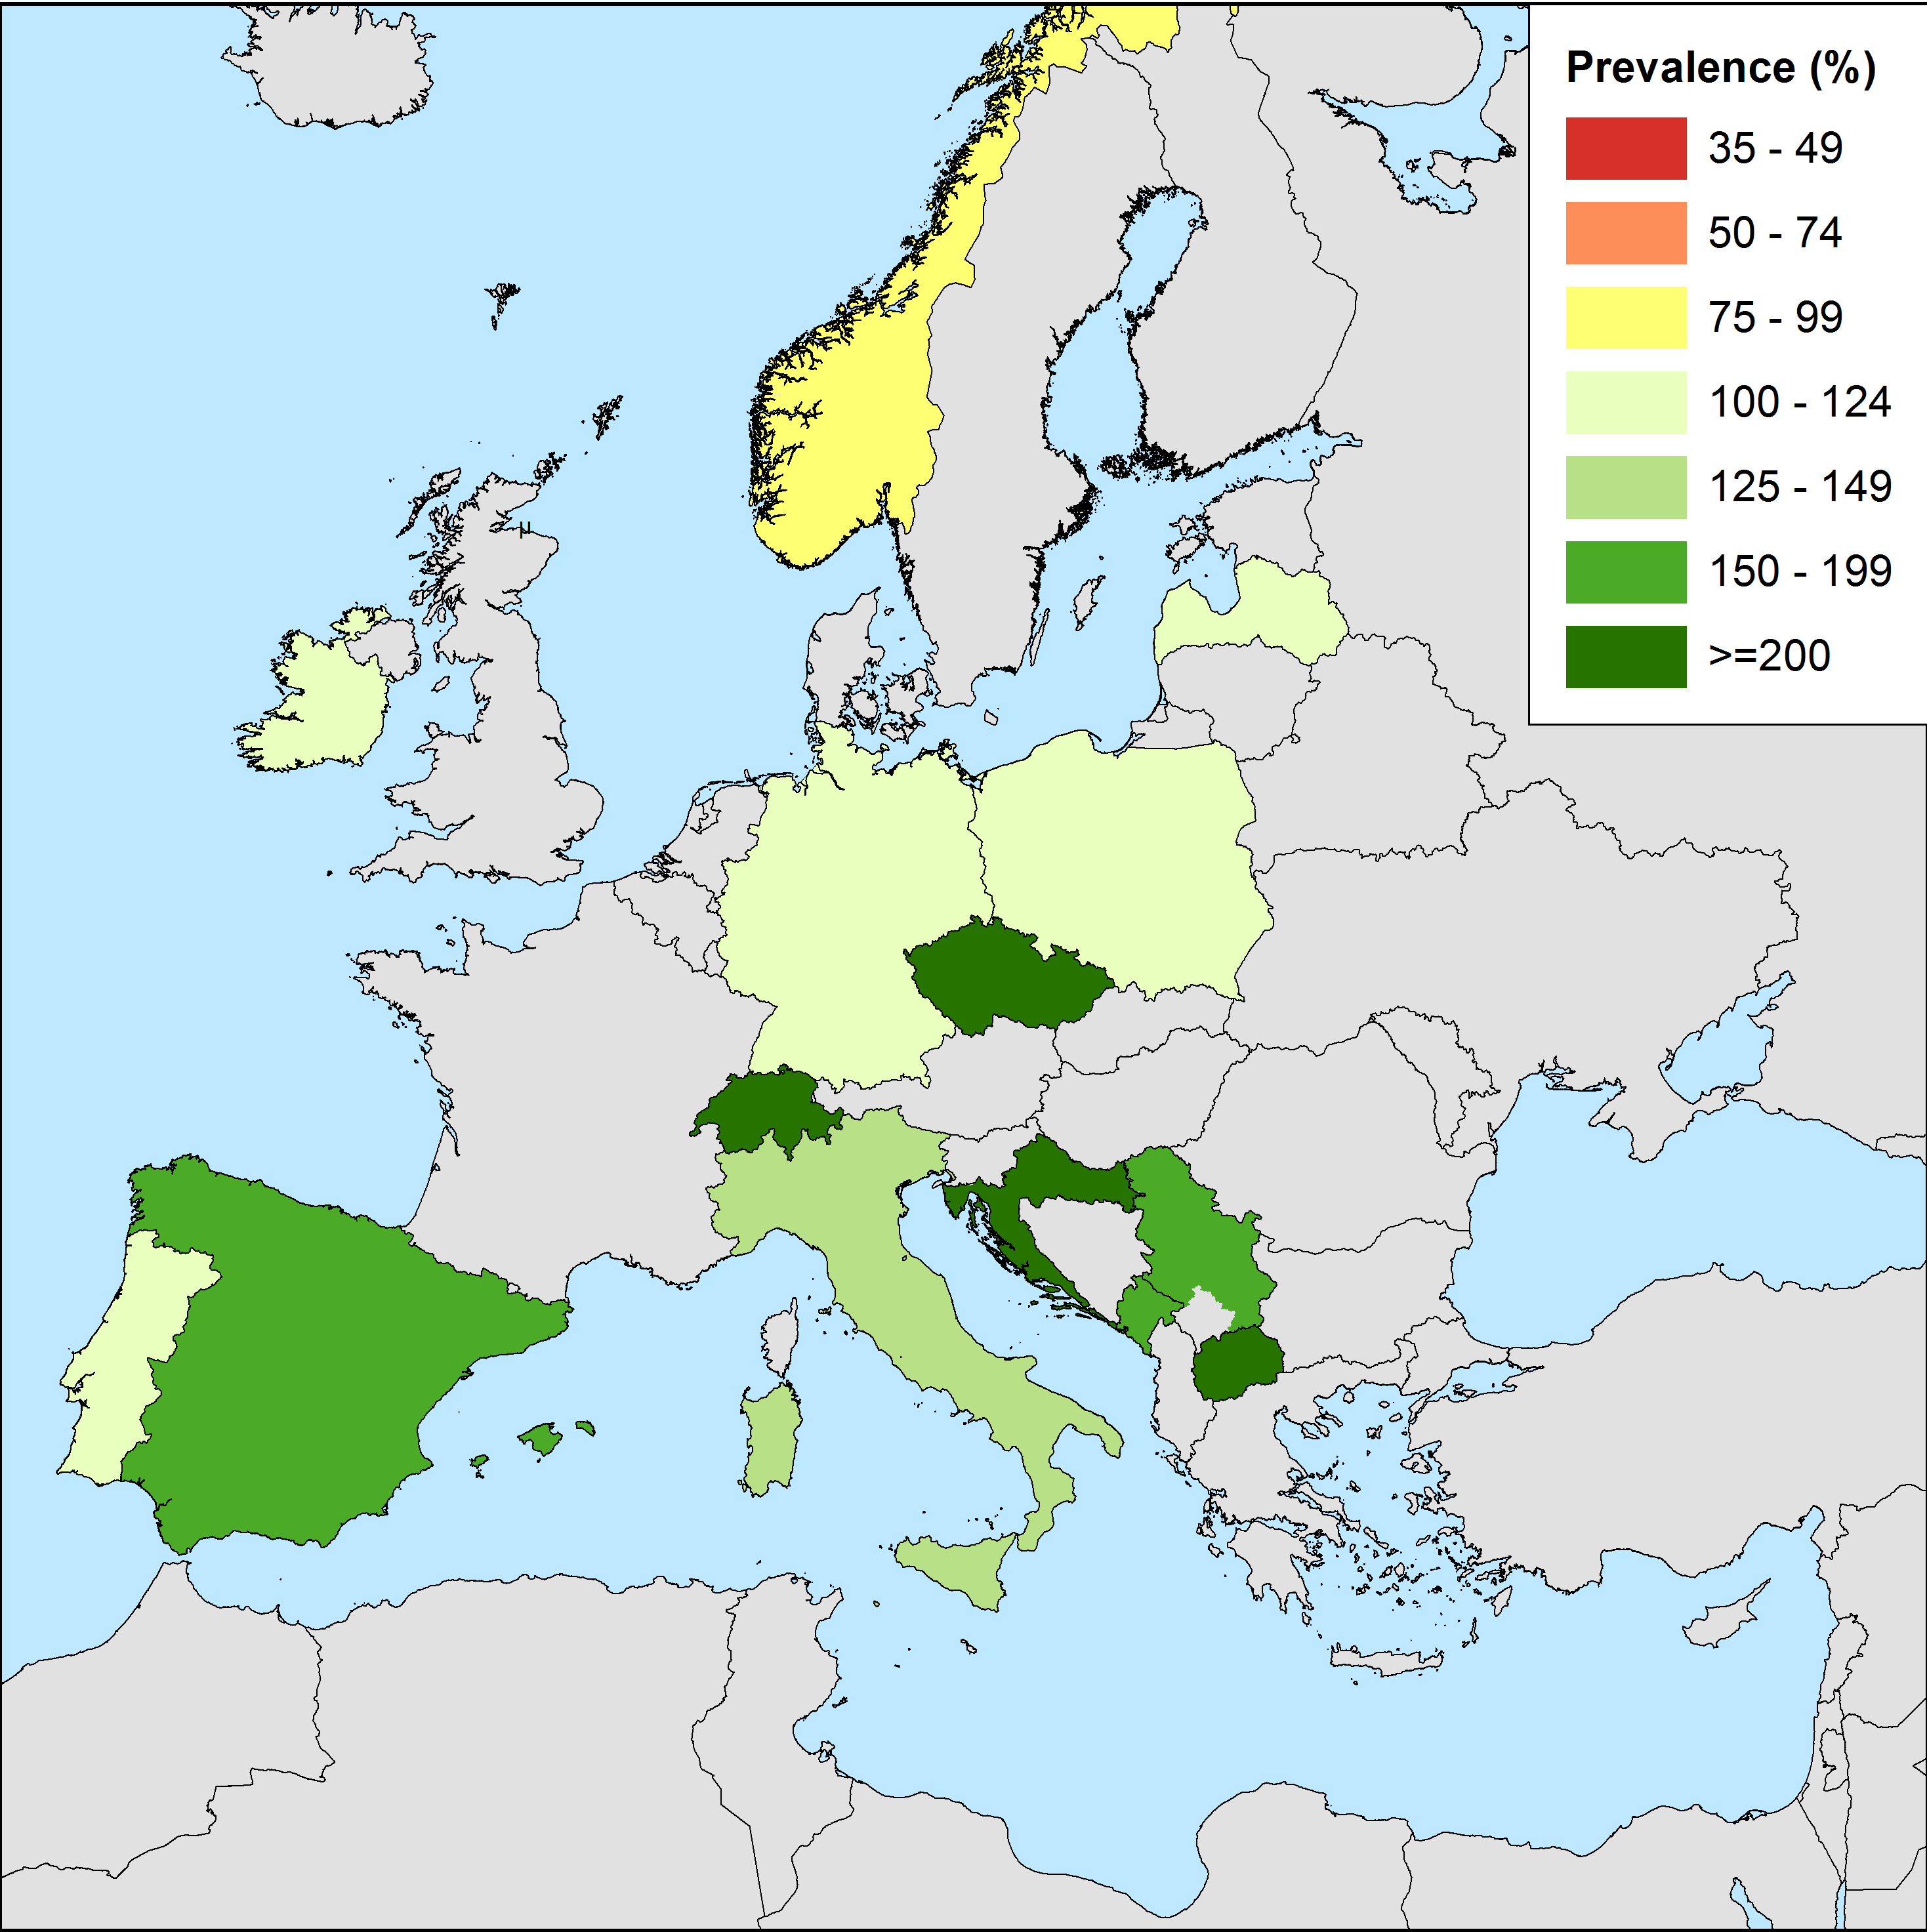
European Map of harmonised Iodine Status
| Iodine (µg/l) | |
|---|---|
| x < 50 | |
| 50 ≤ x < 75 | |
| 75 ≤ x < 100 | |
| 100 ≤ x < 125 | |
| 125 ≤ x < 150 | |
| 150 ≤ x < 200 | |
| 200 ≤ x | |
Source of Administrative boundaries: European Boundary Map (EBM) v9.1, EuroGeographics (2015), The Global Administrative Unit Layers (GAUL) dataset, implemented by FAO within the CountrySTAT and Agricultural Market Information System (AMIS) projects. The data sets are slightly modified by UMG/SHIP (reduced number of points per polygon).
The iodine status of regions is assessed by median urinary iodine concentration (UIC) determined in representative samples of the general population or target population. Data from 53 monitoring studies were uploaded to EUthyroid DEX. A total of 51 studies had UIC measured of which 23 of those were conducted in children, 14 in adults and 14 in pregnant women. The central EUthyroid laboratory in Helsinki (THL) received urine samples from 23 studies and 39 studies could be harmonised for UIC measurement using the conversion formulas established through statistical analysis at UMG. Iodine status is presented based on the actual study region. If more than one study was conducted in one study region the following prioritization was used: IDD monitoring studies in children were preferred over adults, which were preferred of pregnant women. In study regions/countries with multiple IDD monitoring studies of the same subpopulation the most recent was preferred. For a detailed description on the lab methods and statistical analysis, please go to:
> Laboratory method and statistical analysis for cross-lab comparison
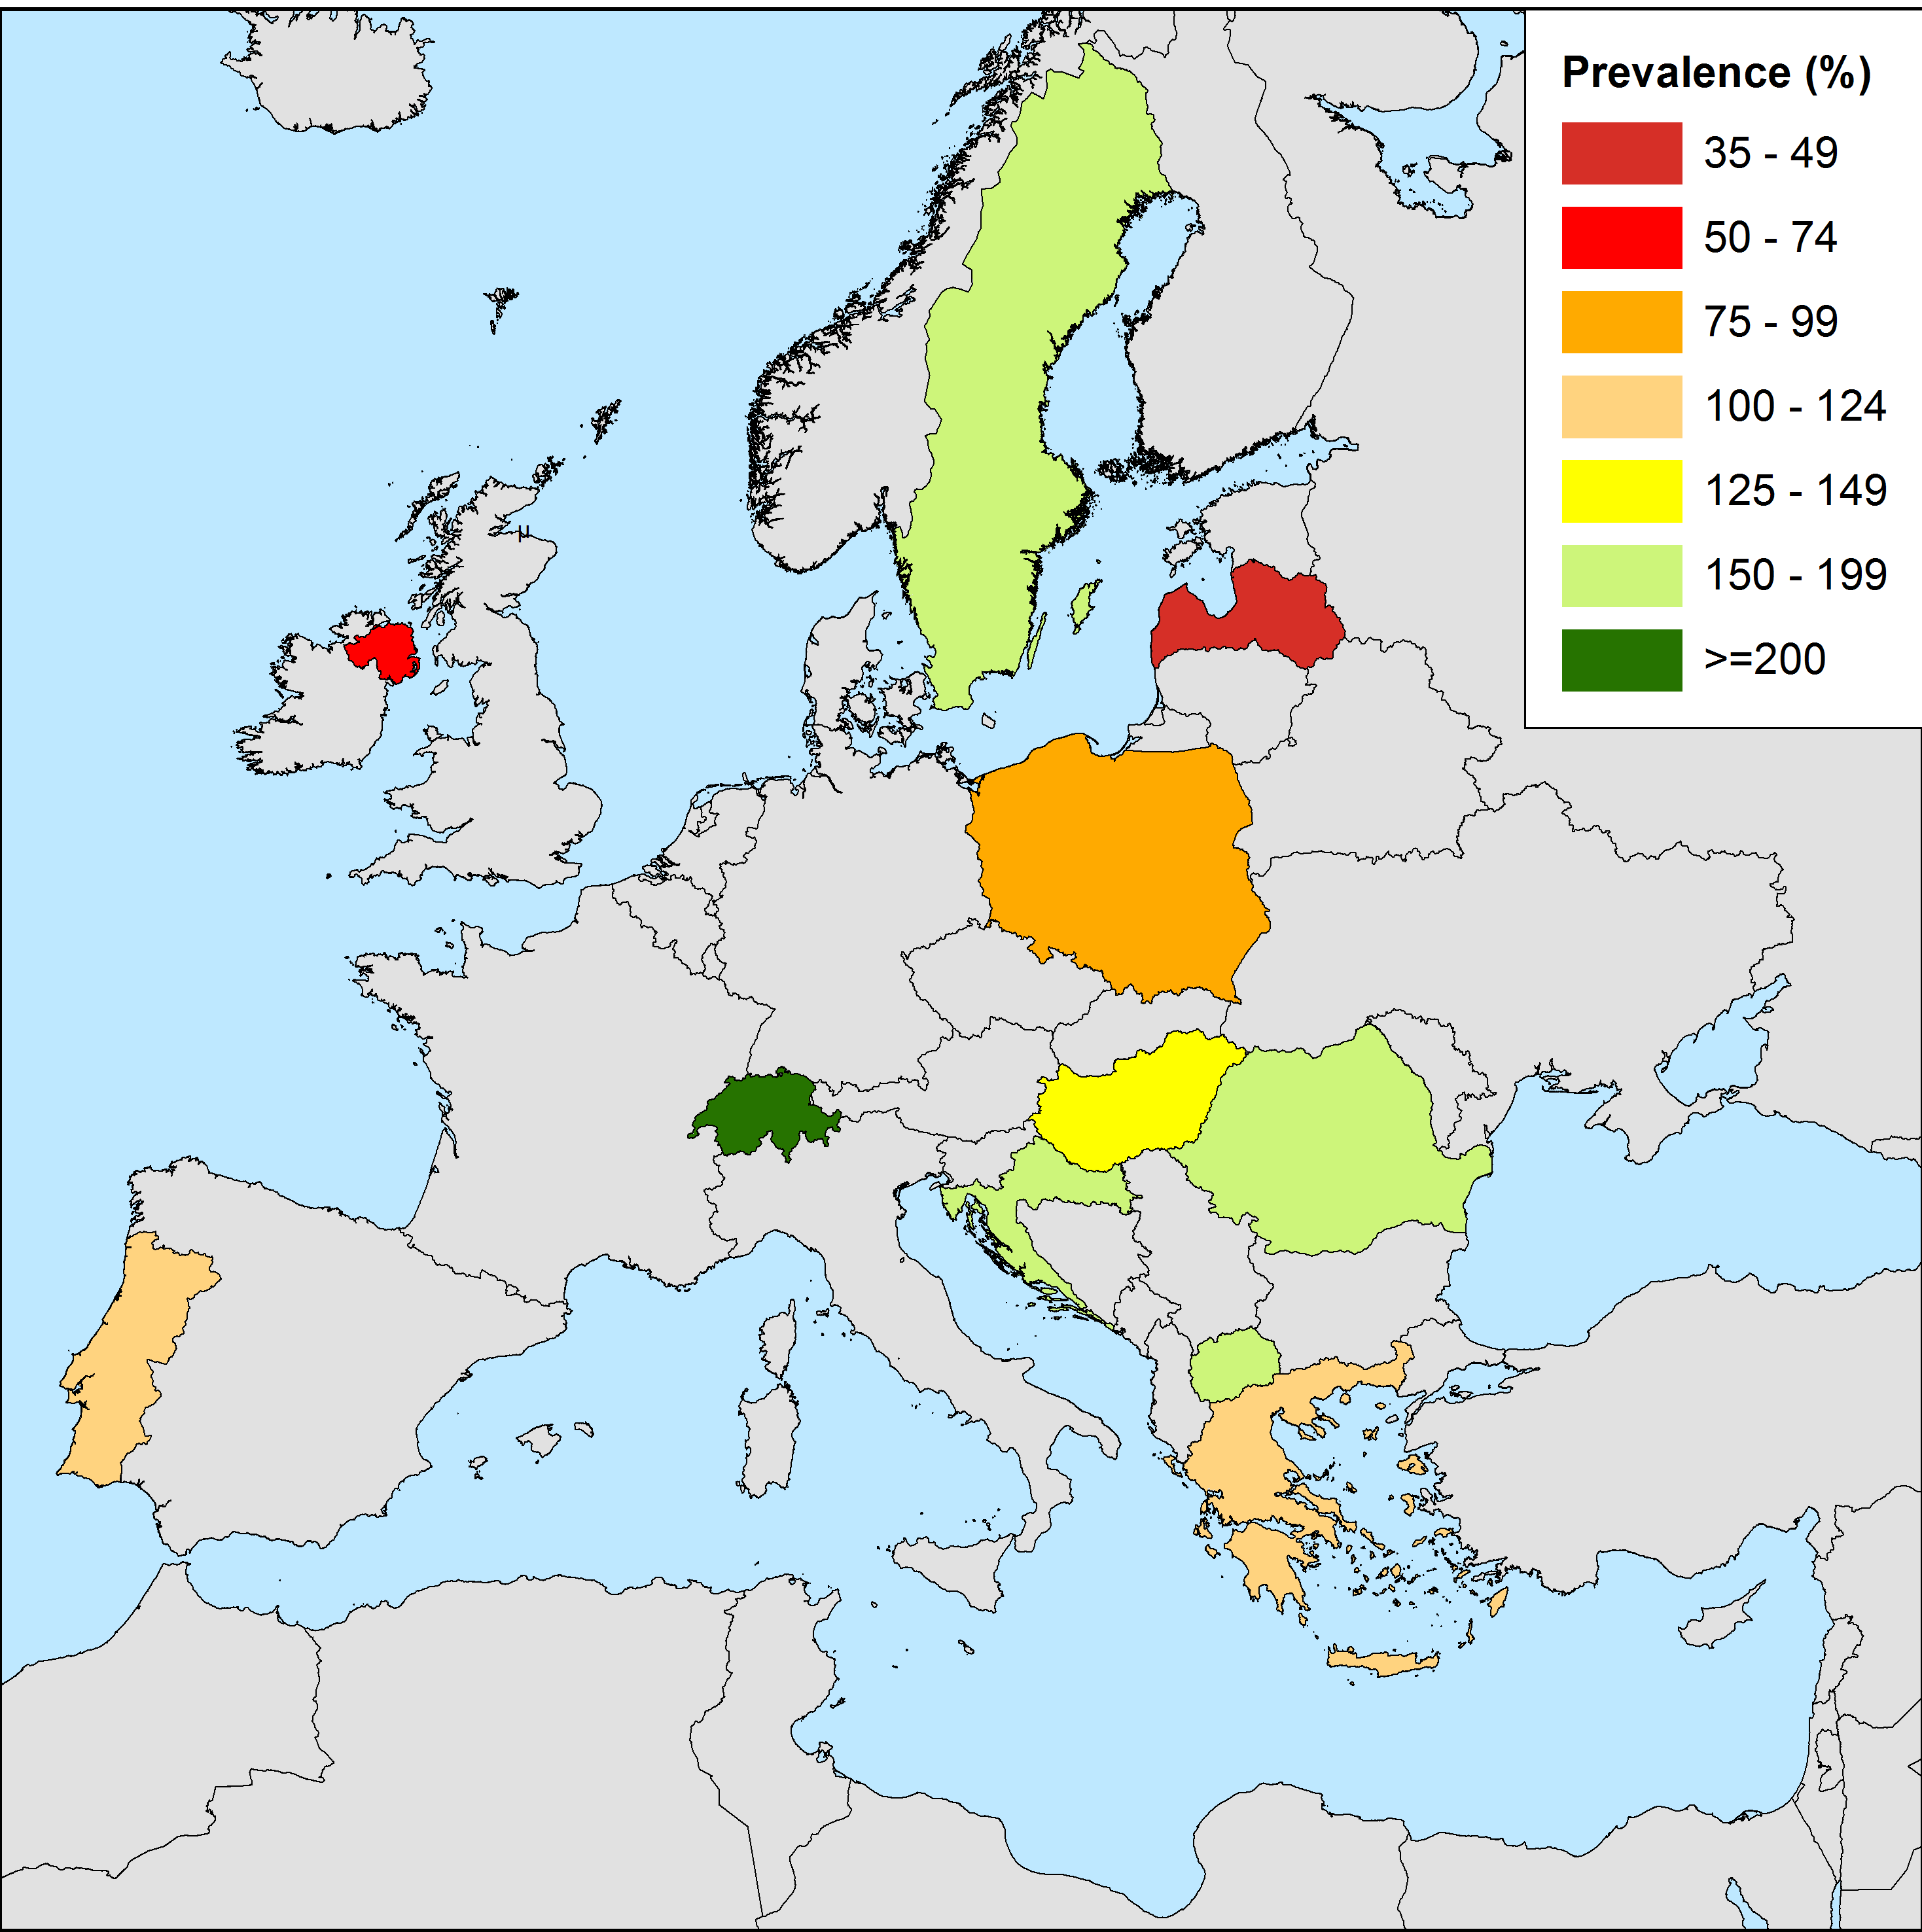
For detailed maps on iodine status of subpopulations by country please click here
> European Map of Iodine Status in Adults
> European Map of Iodine Status in Children
> European Map of Iodine Status in Pregnant Women